5 Critical Financial Metrics to Track During Economic Changes
Discover 5 essential financial metrics that provide a comprehensive view of your financial health during any economic cycle. Learn how to calculate and optimize each metric for greater stability and freedom. #PersonalFinance
As we navigate the ever-changing economic landscape, keeping a close eye on our personal finances becomes crucial. I’ve found that tracking five key financial metrics can provide invaluable insights into our financial health and help us make informed decisions, regardless of where we are in the economic cycle.
Let’s start with the debt-to-income ratio. This metric gives us a clear picture of how much of our monthly income goes towards debt payments. To calculate it, simply add up all your monthly debt payments and divide by your gross monthly income. For example, if you have $1,500 in monthly debt payments and earn $5,000 per month, your debt-to-income ratio would be 30%.
During economic expansions, it’s tempting to take on more debt as confidence in future income grows. However, I’ve learned that maintaining a debt-to-income ratio below 36% provides a solid buffer for unexpected economic downturns. Have you calculated your debt-to-income ratio recently? You might be surprised by what you find.
“The rich rule over the poor, and the borrower is slave to the lender.” - Proverbs 22:7
This ancient wisdom reminds us of the power dynamics at play when we take on debt. While borrowing can be a useful tool, it’s essential to maintain a healthy balance.
Next, let’s consider the savings rate. This metric measures the percentage of our income that we set aside for future use. To calculate it, divide the amount you save each month by your monthly income. During economic expansions, it’s wise to boost your savings rate to build a cushion for leaner times.
I’ve found that aiming for a 20% savings rate during good economic times can provide a substantial safety net. However, don’t be discouraged if you can’t reach this target immediately. Even small increases in your savings rate can make a significant difference over time. What’s your current savings rate? How might you increase it by just 1% this month?
The personal expense ratio is another crucial metric to track. This ratio compares your total expenses to your income, giving you a clear picture of your spending habits. To calculate it, divide your total monthly expenses by your monthly income.
During economic contractions, it’s particularly important to keep this ratio in check. I’ve discovered that maintaining a personal expense ratio below 70% provides flexibility to adjust spending when necessary. This leaves room for savings and unexpected expenses. How does your personal expense ratio stack up? Are there areas where you could trim expenses without significantly impacting your quality of life?
“Annual income twenty pounds, annual expenditure nineteen nineteen six, result happiness. Annual income twenty pounds, annual expenditure twenty pounds ought and six, result misery.” - Charles Dickens, David Copperfield
Dickens eloquently captures the fine line between financial comfort and distress. By tracking our personal expense ratio, we can ensure we stay on the right side of that line.
Investment diversification is a concept we often hear about, but how can we measure it? I’ve developed a simple diversification score based on asset correlation. Start by listing your investments and their current values. Then, research the correlation between each pair of assets. Assign a score of 0 for highly correlated assets (0.7 or higher), 0.5 for moderately correlated assets (0.3 to 0.7), and 1 for lowly correlated assets (below 0.3).
Sum these scores and divide by the total number of possible pairs to get your diversification score. A score closer to 1 indicates better diversification. I aim for a score above 0.6, adjusting my portfolio when it falls below this threshold. What’s your current diversification score? How might you improve it?
Lastly, tracking progress toward financial independence can provide motivation and direction throughout economic cycles. The 4% rule, which suggests you can safely withdraw 4% of your portfolio annually in retirement, offers a simple way to measure this progress.
Multiply your annual expenses by 25 to determine your financial independence target. Then, divide your current investment portfolio value by this target to get your financial independence progress percentage. For instance, if your annual expenses are $50,000, your target would be $1,250,000. If your current portfolio is worth $500,000, you’re 40% of the way to financial independence.
I find it inspiring to watch this percentage grow over time, especially during economic expansions. During contractions, it serves as a reminder of the progress I’ve made and motivates me to stay the course. What’s your current financial independence progress? How might you accelerate it?
“The goal isn’t more money. The goal is living life on your terms.” - Chris Brogan
This quote reminds us that financial independence isn’t about accumulating wealth for its own sake, but about creating the freedom to live life on our own terms.
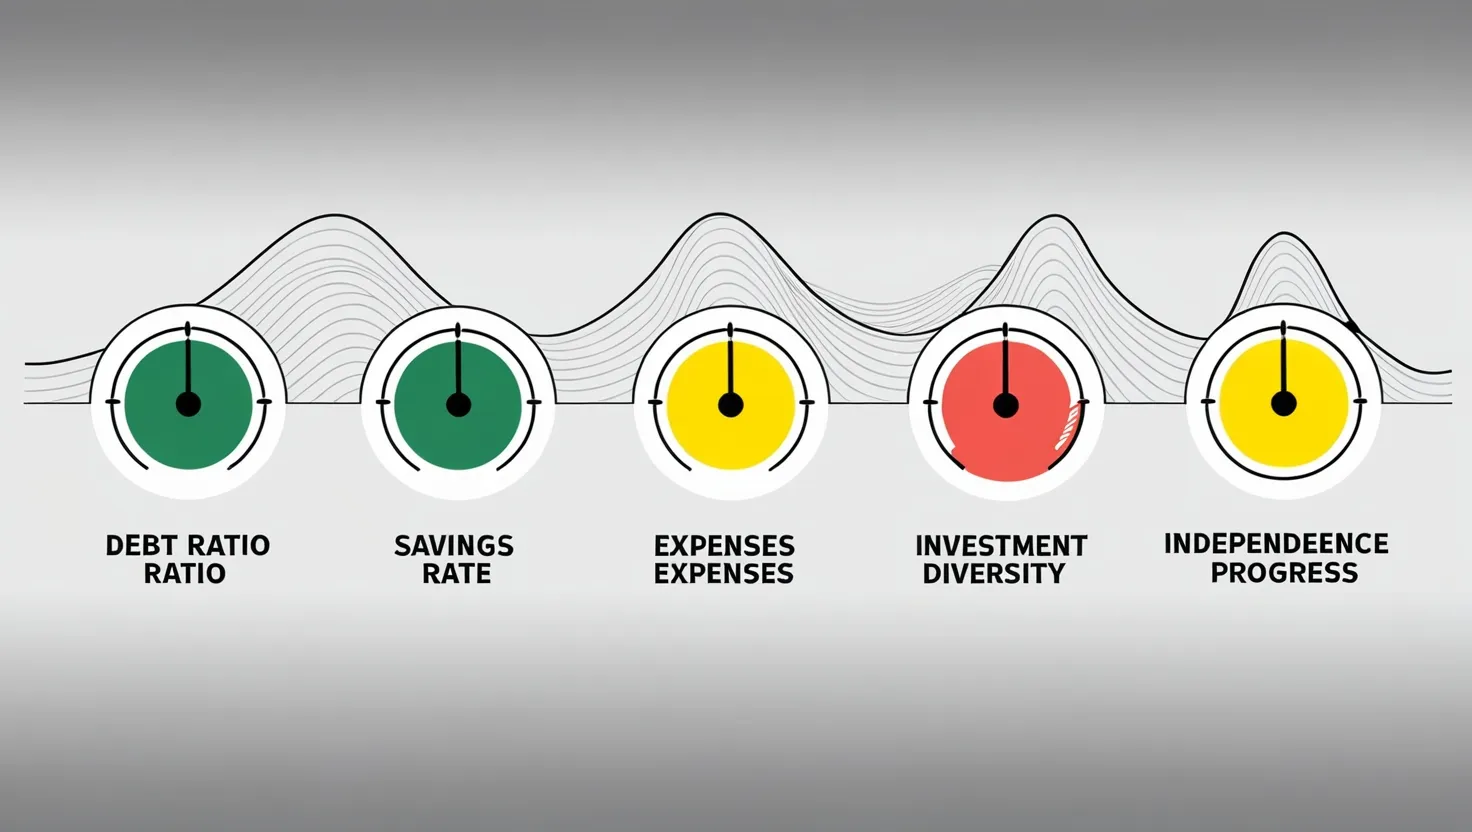
By tracking these five metrics - debt-to-income ratio, savings rate, personal expense ratio, investment diversification score, and financial independence progress - we gain a comprehensive view of our financial health. But remember, these metrics are tools, not rules. They should inform our decisions, not dictate them.
I’ve found it helpful to create a simple dashboard to monitor these metrics monthly. This practice keeps financial health top of mind and allows for timely adjustments. Consider setting alert thresholds for each metric. For example, you might decide to review your budget if your personal expense ratio exceeds 75% for two consecutive months.
Historical data can reveal personal financial vulnerabilities. By examining how these metrics fluctuated during past economic cycles, we can identify areas that need strengthening. Perhaps your debt-to-income ratio spiked during the last recession, suggesting a need for a larger emergency fund or more conservative borrowing habits.
As we track these metrics, it’s important to adjust our targets based on current economic conditions. During expansions, we might push for more aggressive savings rates and faster progress toward financial independence. In contractions, we might focus more on maintaining a low debt-to-income ratio and a robust diversification score.
Remember, financial health isn’t about perfection, but progress. These metrics provide a roadmap, helping us navigate the twists and turns of economic cycles. By consistently monitoring and adjusting based on these indicators, we can build resilience and work towards our financial goals, regardless of economic conditions.
What’s one metric you’ll start tracking today? How might it change your financial decisions moving forward? As we continue to refine our financial strategies, these questions can guide us toward greater financial stability and freedom.
In the end, financial metrics are just numbers on a page. It’s the actions we take based on these numbers that truly matter. So let’s use these tools to inform our decisions, guide our progress, and ultimately, create the financial future we envision for ourselves. After all, isn’t that what financial management is really about?